
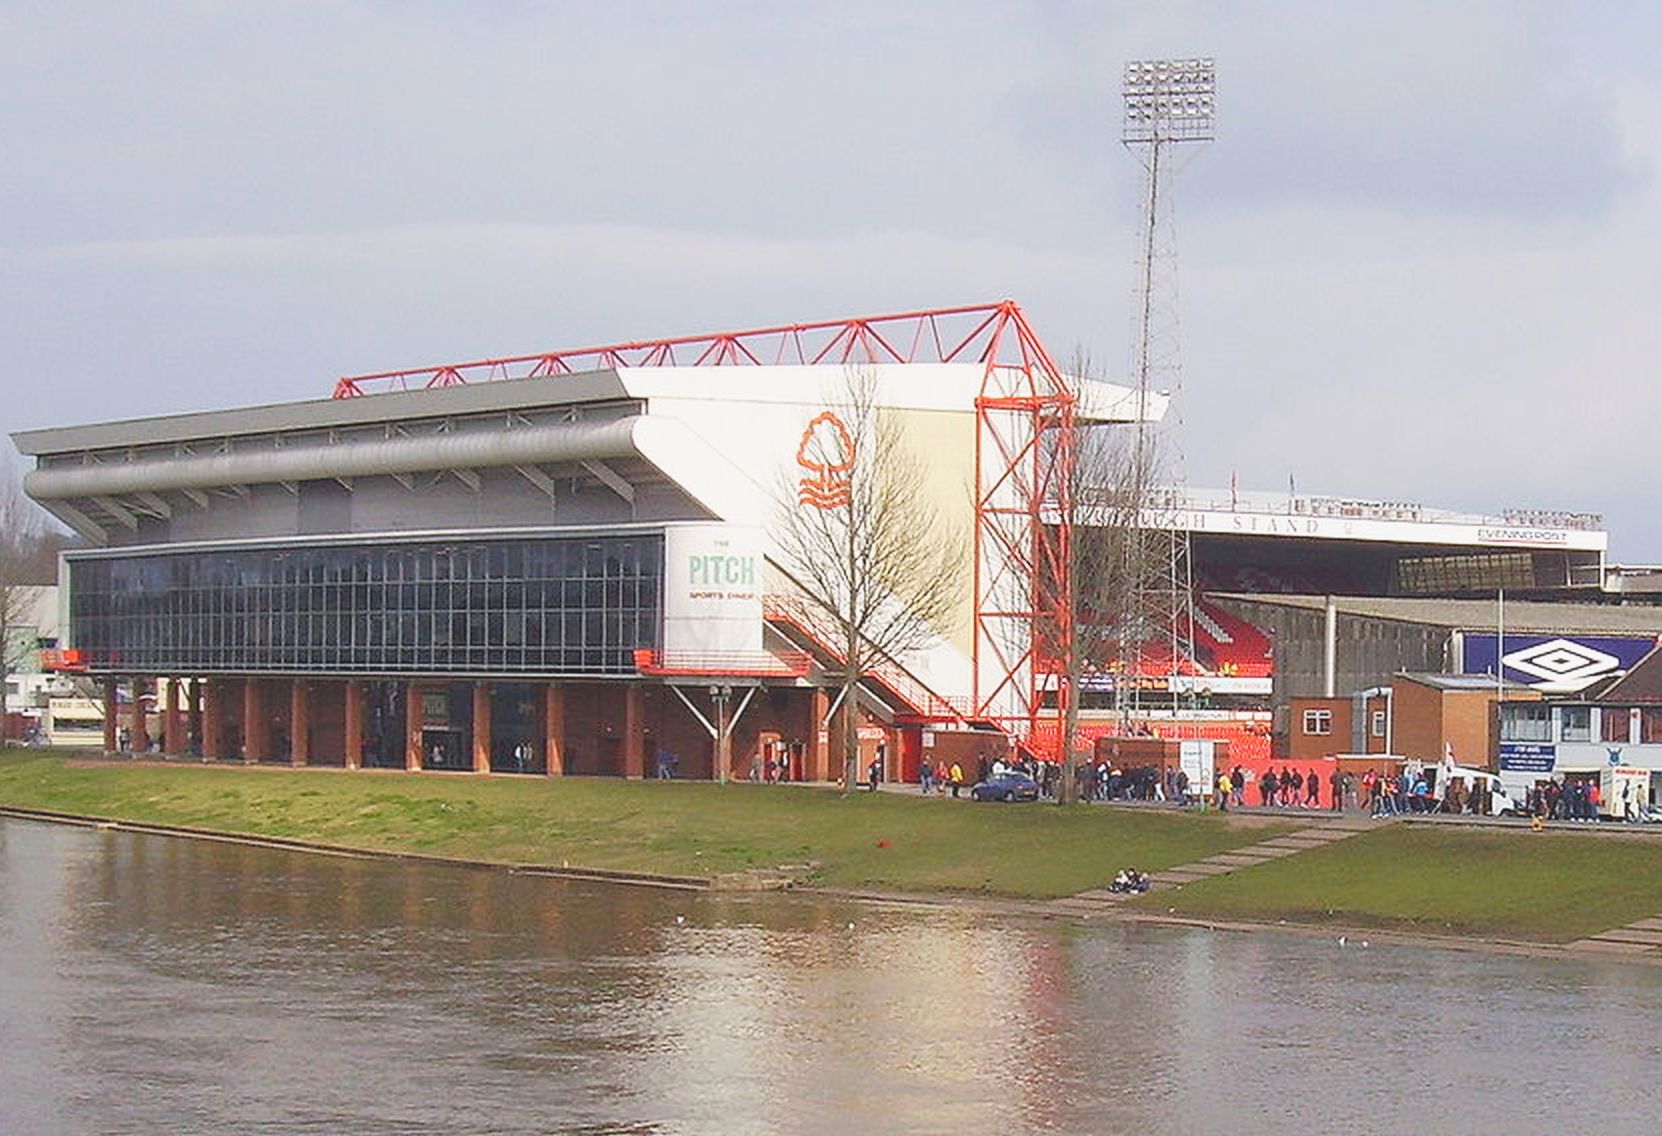
How many points keep you up? Relegation lines in Europe's top five leagues
We read the final tables of 143 seasons to find how many points it took to stay up. The average survivor finished on about 39 points per 38 games — the old 40-point rule is too high in England and Italy, but not in Spain.
"Forty points keeps you up" is the oldest rule of thumb in English football, and it travels well: every league has a number its supporters quote from the autumn onwards. We tested it against the record. For each of 143 seasons in the Premier League, Serie A, La Liga, Bundesliga and Ligue 1, we looked at the final table and asked two questions: how few points did the lowest-placed club that stayed up have, and how many did the best club that went down?
The answer depends on the league. Scaled to a 38-game season, the lowest survivor averaged 38.0 points in the Premier League, 37.4 in Serie A and 40.2 in La Liga. In England 40 points was more than enough in 22 of 31 seasons, and only three relegated clubs ever reached it; in Spain a relegated club had 40 or more in 12 of 29 seasons. And in every league the bar is lower today than in the earliest decade we have.
The method
The study uses the final table of every season in a stable era of each league, all with three points for a win: the Premier League from 1995-96 (31 seasons, 20 clubs, three relegation places), Serie A from 2004-05 (21 seasons, with 2005-06 set aside because Juventus were placed last and demoted by sanction), La Liga from 1997-98 (29), the Bundesliga from 1995-96 (31, with 18 clubs) and Ligue 1 from 1994-95 (31, leaving out the curtailed 2019-20). Together that is 143 seasons. The wins, draws and goals in these tables were checked against match results in our halfway-table studies, and here every club's points equal three times its wins plus its draws, except for 26 club-seasons that carry a points deduction.
The "safe mark" of a season is the points total of the lowest-placed club that stayed up, which includes clubs that survived a relegation play-off. The most points a relegated club had is the other side of the line. Points are the official ones, deductions included: Nottingham Forest's 32 in 2023-24, for example, is after a four-point deduction. We set aside two administrative decisions that have nothing to do with points: Elche were relegated in 2014-15 for unpaid debts after finishing 13th, and Eibar (18th) stayed up in their place; and Saint-Étienne were reprieved in 1994-95. Neither counts as a safe mark.
Leagues differ in size and format, so we compare them in points per 38-game season: points per game, multiplied by 38. The Bundesliga has played 34-game seasons throughout, and Ligue 1 switched between 38 and 34 games. The number of relegated clubs also varies: three in most seasons, but two plus a play-off for the Bundesliga since 2008-09 and for Ligue 1 in some years, and four in La Liga in 1998-99, Ligue 1 in 1996-97 and 2022-23.
How many points does it take?
- Premier League: 38 pts
- Serie A: 37.4 pts
- La Liga: 40.2 pts
- Bundesliga: 38.5 pts
- Ligue 1: 39.8 pts
La Liga asks for the most, Serie A and the Premier League for the least, but the differences are small next to the season-to-season swings. In every league the safe mark has moved across a range of 10 to 14 points: from 32 to 44 in England, 31 to 42 in Italy, 35 to 45 in Spain, 27 to 40 in Germany (in a 34-game season) and 32 to 46 in France. A single average is a guide, not a target.
| League | Seasons | Lowest safe mark | Highest safe mark | Most points by a relegated club |
|---|---|---|---|---|
| Premier League | 31 | 32 (Nottingham Forest, 2023-24) | 44 (Bolton, 2002-03) | 42 (West Ham, 2002-03) |
| Serie A | 21 | 31 (Salernitana, 2021-22; Verona, 2022-23) | 42 (Parma, 2004-05; Bologna, 2009-10; Genoa, 2011-12) | 42 (Bologna, 2004-05) |
| La Liga | 29 | 35 (Granada, 2014-15; Leganés, 2016-17) | 45 (Numancia, 1999-2000) | 44 (Compostela, 1997-98) |
| Bundesliga (34 games) | 31 | 27 (Hamburg, 2013-14) | 40 (Hansa Rostock, 1996-97; Leverkusen, 2002-03) | 38 (Karlsruhe, 1997-98) |
| Ligue 1 | 31 | 32 (Le Havre, 2023-24; Nice, 2025-26) | 46 (Nice, 2010-11) | 44 (Monaco, 2010-11) |
Is 40 points the magic number?
- Premier League: 9.7%
- Serie A: 4.8%
- La Liga: 41.4%
- Bundesliga: 12.9%
- Ligue 1: 19.4%
In England the rule is generous. Only Sunderland (40 points in 1996-97), Bolton (40 in 1997-98) and West Ham (42 in 2002-03) were relegated with 40 or more, and the lowest-placed survivor had fewer than 40 in 22 of the 31 seasons. In Italy it is more generous still: only Bologna, with 42 in 2004-05, went down with 40 or more. Spain is the exception: a relegated club reached 40 points in 12 of 29 seasons, from Compostela's 44 in 1997-98 to Mallorca's 42 in 2025-26. In La Liga, 40 is a minimum, not a margin.
Elsewhere the line is thin. On average, the best relegated club finished 3.3 points below the lowest survivor in the Premier League, 2.7 in Serie A, 2.1 in La Liga, 2.8 in the Bundesliga and 2.7 in Ligue 1. In 13 of the 143 seasons (9%), the two sides of the line were level on points.
Thirteen seasons level on points
- Premier League: Southampton and Manchester City (38, 1995-96), Everton and Bolton (40, 1997-98), Wigan and Sheffield United (38, 2006-07), Fulham and Reading (36, 2007-08).
- Serie A: Parma and Bologna (42, 2004-05), Genoa and Empoli (38, 2018-19), Verona and Spezia (31, 2022-23).
- La Liga: Getafe and Betis (42, 2008-09), Osasuna and Mallorca (42, 2025-26).
- Bundesliga: Mönchengladbach and Karlsruhe (38, 1997-98), Eintracht Frankfurt and Nuremberg (37, 1998-99).
- Ligue 1: Le Havre and Lorient (35, 1998-99), Marseille and Nancy (42, 1999-2000).
The bar has come down
| League | 1990s | 2000s | 2010s | 2020s |
|---|---|---|---|---|
| Premier League | 39.2 | 38.1 | 37.6 | 37.3 |
| Serie A | – | 39.6 | 38.0 | 34.5 |
| La Liga | 41.7 | 41.0 | 39.3 | 39.5 |
| Bundesliga | 42.7 | 39.2 | 37.3 | 36.0 |
| Ligue 1 | 41.0 | 40.9 | 39.7 | 36.9 |
In all five leagues the average safe mark is lower in the 2020s than in the earliest decade we have, by between 1.9 points (England) and 6.7 (Germany). Italy has fallen furthest in recent years, to 34.5 points in the 2020s, with Salernitana and Verona both staying up on 31 and no relegated club above 35. Two caveats apply. In the Bundesliga, the 16th-placed club has played a relegation play-off since 2008-09, so the lowest-placed survivor is now often 16th rather than 15th, which lowers the mark mechanically. And Ligue 1 went from 20 clubs to 18 in 2023-24.
We cannot say from this data why the number is falling, and it would be a mistake to assume it means the bottom of the table is getting weaker. A lower line can come from stronger bottom clubs, from more draws, or from more points going to the same few clubs at the top.
The extremes
- Fewest points to stay up in a 38-game season: 31, by Salernitana (17th, 2021-22) and Verona (18th, 2022-23, who won a relegation play-off).
- In a 34-game season: Hamburg's 27 in 2013-14 and Heidenheim's 29 in 2024-25, both through the Bundesliga's relegation play-off.
- Premier League: Nottingham Forest's 32 in 2023-24, after a four-point deduction, and West Bromwich Albion's 34 in 2004-05 are the two lowest.
- Most points not enough: Compostela's 44 in La Liga in 1997-98 (17th, beaten in the relegation play-off), Monaco's 44 in Ligue 1 in 2010-11 and Deportivo La Coruña's 43 in La Liga in 2010-11.
- In a 34-game season, Nancy's 42 points in Ligue 1 in 1999-2000 were not enough, 1.24 points a game — the highest rate of any relegated club in the data.
- A bad year for the bottom three: in 2024-25 no Premier League relegated club got past 25 points (Leicester).
Season by season: the safe mark
| Season | Premier League | Serie A | La Liga | Bundesliga | Ligue 1 |
|---|---|---|---|---|---|
| 1994-95 | – | – | – | – | 41 |
| 1995-96 | 38 | – | – | 38 | 39 |
| 1996-97 | 41 | – | – | 40 | 40 |
| 1997-98 | 40 | – | 40* | 38 | 36 |
| 1998-99 | 41 | – | 40 | 37 | 35 |
| 1999-00 | 36 | – | 45 | 38 | 42 |
| 2000-01 | 42 | – | 42 | 38 | 40 |
| 2001-02 | 40 | – | 42 | 34 | 35 |
| 2002-03 | 44 | – | 43 | 40 | 39 |
| 2003-04 | 39 | – | 42 | 36 | 39 |
| 2004-05 | 34 | 42 | 39 | 36 | 43 |
| 2005-06 | 38 | – | 40 | 34 | 39 |
| 2006-07 | 38 | 40 | 40 | 37 | 43 |
| 2007-08 | 36 | 37 | 43 | 34 | 42 |
| 2008-09 | 35 | 37 | 42 | 31 | 40 |
| 2009-10 | 35 | 42 | 37 | 31* | 40 |
| 2010-11 | 40 | 41 | 44 | 36* | 46 |
| 2011-12 | 37 | 42 | 42 | 36 | 39 |
| 2012-13 | 39 | 38 | 37 | 31* | 40 |
| 2013-14 | 36 | 34 | 40 | 27* | 42 |
| 2014-15 | 38 | 37 | 35 | 35* | 42 |
| 2015-16 | 39 | 39 | 39 | 36* | 40 |
| 2016-17 | 40 | 34 | 35 | 37* | 37 |
| 2017-18 | 36 | 38 | 43 | 33* | 37* |
| 2018-19 | 36 | 38 | 41 | 32 | 34* |
| 2019-20 | 35 | 39 | 37 | 31* | – |
| 2020-21 | 39 | 37 | 36 | 33* | 40* |
| 2021-22 | 38 | 31 | 39 | 33* | 36 |
| 2022-23 | 36 | 31* | 41 | 33* | 36 |
| 2023-24 | 32 | 36 | 38 | 33* | 32 |
| 2024-25 | 38 | 34 | 41 | 29* | 34 |
| 2025-26 | 41 | 38 | 42 | 32 | 32* |
How this fits with the rest of our work
Our halfway-table studies showed how often the club bottom at the halfway mark goes down: 87% of the time in the Premier League, 95% in Serie A, 81% in the Bundesliga and 76% in La Liga. This study adds the other half of the question, how many points it takes to avoid that fate. La Liga, where the bottom club escapes most often, is also the league where the line is highest.
What this doesn't mean
An average safe mark is not a target for any club in any year: the line is set by the other teams at the bottom, and it moves by a dozen points from one season to the next. The samples are modest (21 to 31 seasons per league, and as few as three or five seasons in some decades). Formats changed — the Bundesliga's play-off, Ligue 1's size, the number of relegated clubs — and we have treated survivors and relegated clubs as the record states them. Points deductions, which affect 26 club-seasons, are included, so a few safe marks (Nottingham Forest's among them) are lower than the points won on the pitch.
Picks for you
Advertising. Affiliate links — we may earn a commission on your purchases, at no extra cost to you. It does not influence our editorial coverage.
Keep reading
 Stats
How early is the title decided? 145 champions across Europe's top five leagues
We replayed 145 league titles to find the first day each was mathematically certain. The average champion had 2.1 games to spare, 27% waited for their final game, and the earliest of all had eight to spare.
 Stats
What is the most common score in football? 50,064 matches from Europe's top five leagues
We counted every scoreline in 28 seasons of the Premier League, Serie A, La Liga, Bundesliga and Ligue 1. 1-1 is the most common, nearly two matches in three are draws or one-goal wins, and 0-0 is fading.
 Stats
The three-point era table: who has won the most league points in Europe's top five leagues?
We added up every club's points in the three-point era of the Premier League, Serie A, La Liga, Bundesliga and Ligue 1. Manchester United lead the raw total, Bayern Munich the points per game, and Ligue 1 has the most different champions.