
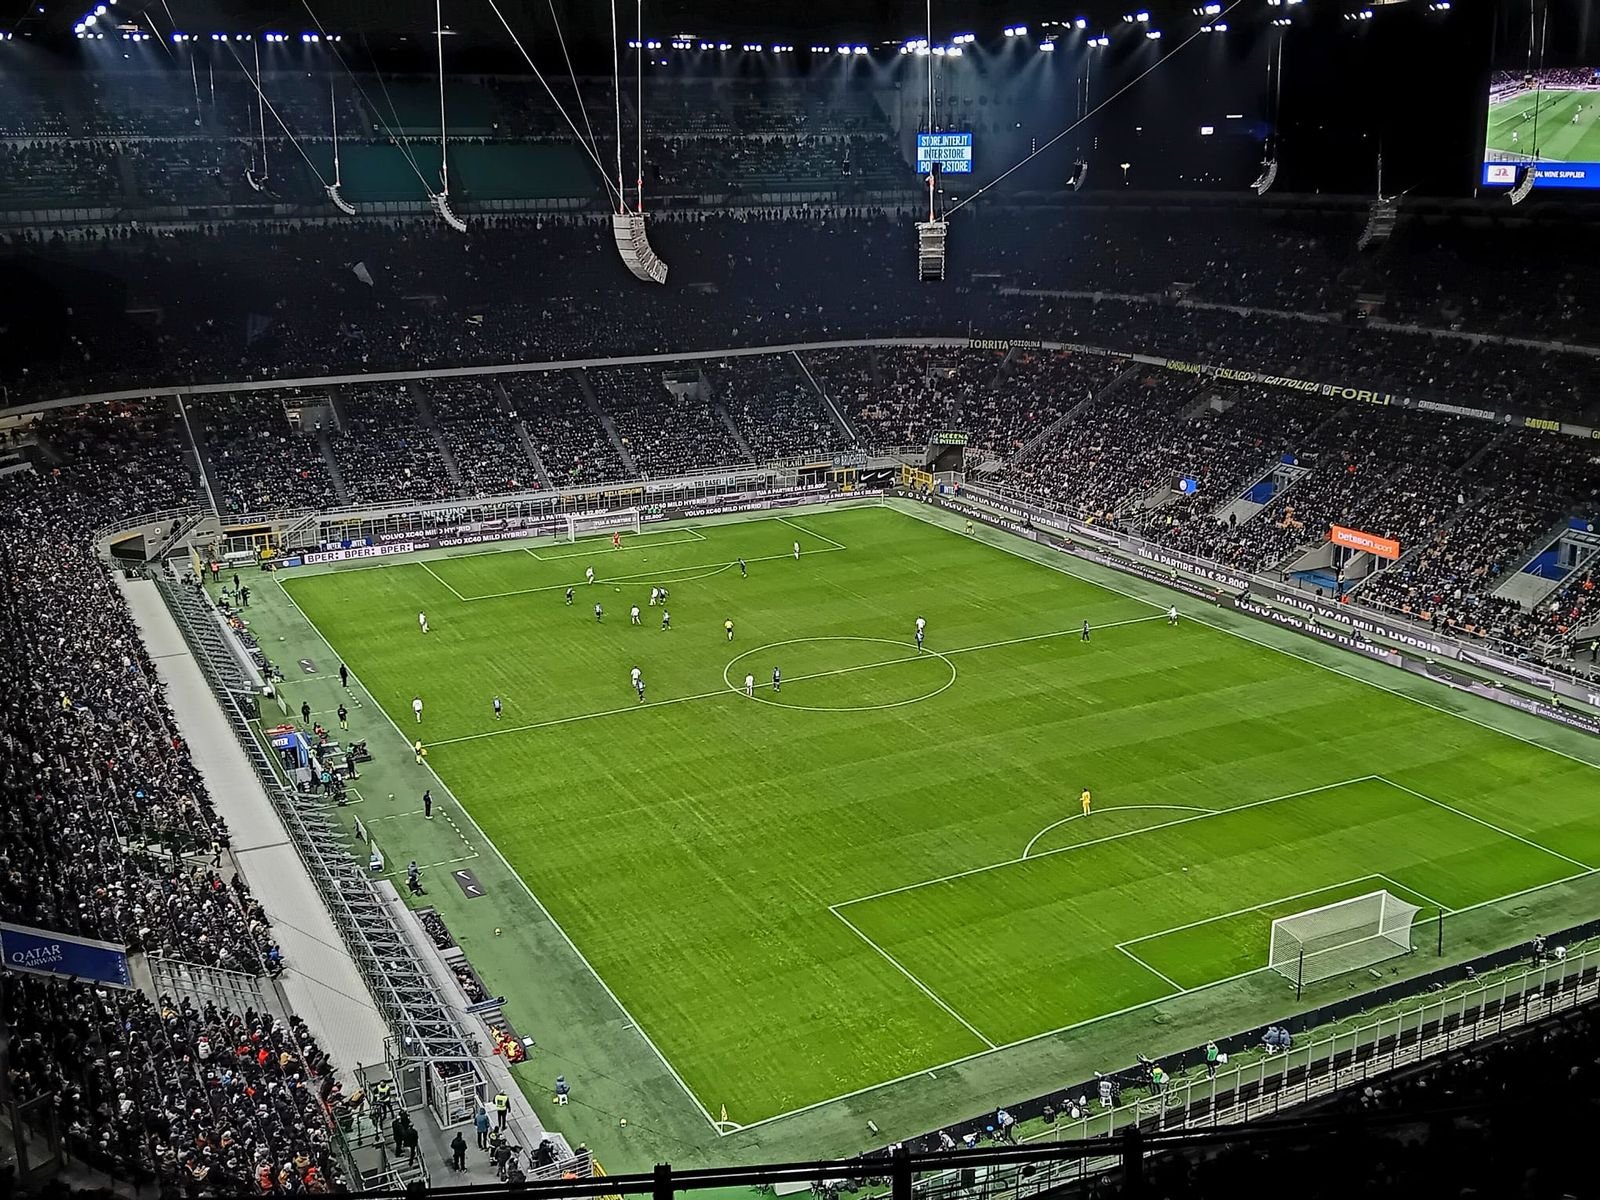
Serie A goals per match since 1994: is calcio really that defensive?
32 seasons of Serie A scoring data, checked and recomputed, show the competition's most defensive season on record isn't from the catenaccio era — it's the one that just finished.
Serie A's reputation abroad has barely changed since the 1990s: tactical, disciplined, and light on goals compared with the Premier League or the Bundesliga. We wanted to know whether that reputation still matches the numbers, so we pulled the goals and matches for every Serie A season since the three-points-for-a-win rule arrived in 1994-95, worked out the per-match rate ourselves for each one, and checked it against the stereotype.
The answer complicates the cliché rather than confirming or debunking it outright: Serie A did have a genuinely defensive stretch, but it wasn't the 1990s — it's happening right now.
The method
Every season's total goals and matches played were checked against that season's own official record and recomputed by hand. Serie A's club count changed once in this window: 18 clubs and 306 matches a season from 1994-95 through 2003-04, expanding to 20 clubs and 380 matches from 2004-05 onward, unchanged since. Because we're comparing the rate per match rather than the raw total, that expansion doesn't distort the trend line — a 20-club season isn't scored as "higher" just for having more games.
Season by season
- 1994-95: 2.53
- 1996-97: 2.65
- 1998-99: 2.76
- 2000-01: 2.76
- 2002-03: 2.58
- 2004-05: 2.53
- 2006-07: 2.55
- 2008-09: 2.6
- 2010-11: 2.51
- 2012-13: 2.63
- 2014-15: 2.69
- 2016-17: 2.96
- 2018-19: 2.68
- 2019-20: 3.04
- 2021-22: 2.87
- 2023-24: 2.61
- 2025-26: 2.43
The full season-by-season data
| Season | Clubs | Matches | Goals | Goals/match |
|---|---|---|---|---|
| 1994-95 | 18 | 306 | 773 | 2.53 |
| 1995-96 | 18 | 306 | 805 | 2.63 |
| 1996-97 | 18 | 306 | 810 | 2.65 |
| 1997-98 | 18 | 306 | 835 | 2.73 |
| 1998-99 | 18 | 306 | 845 | 2.76 |
| 1999-00 | 18 | 306 | 764 | 2.50 |
| 2000-01 | 18 | 306 | 845 | 2.76 |
| 2001-02 | 18 | 306 | 806 | 2.63 |
| 2002-03 | 18 | 306 | 789 | 2.58 |
| 2003-04 | 18 | 306 | 816 | 2.67 |
| 2004-05 | 20 | 380 | 960 | 2.53 |
| 2005-06 | 20 | 380 | 991 | 2.61 |
| 2006-07 | 20 | 380 | 969 | 2.55 |
| 2007-08 | 20 | 380 | 970 | 2.55 |
| 2008-09 | 20 | 380 | 988 | 2.60 |
| 2009-10 | 20 | 380 | 992 | 2.61 |
| 2010-11 | 20 | 380 | 955 | 2.51 |
| 2011-12 | 20 | 380 | 972 | 2.56 |
| 2012-13 | 20 | 380 | 1,000 | 2.63 |
| 2013-14 | 20 | 380 | 1,035 | 2.72 |
| 2014-15 | 20 | 380 | 1,024 | 2.69 |
| 2015-16 | 20 | 380 | 979 | 2.58 |
| 2016-17 | 20 | 380 | 1,123 | 2.96 |
| 2017-18 | 20 | 380 | 1,017 | 2.68 |
| 2018-19 | 20 | 380 | 1,019 | 2.68 |
| 2019-20 | 20 | 380 | 1,154 | 3.04 |
| 2020-21 | 20 | 380 | 1,163 | 3.06 |
| 2021-22 | 20 | 380 | 1,089 | 2.87 |
| 2022-23 | 20 | 380 | 974 | 2.56 |
| 2023-24 | 20 | 380 | 992 | 2.61 |
| 2024-25 | 20 | 380 | 973 | 2.56 |
| 2025-26 | 20 | 380 | 922 | 2.43 |
A mild rise overall, with a pandemic-era spike
Split the run in half and there's a small, genuine rise: the first 16 seasons (1994-95 to 2009-10) averaged 2.61 goals per match, and the second 16 (2010-11 to 2025-26) averaged 2.70. Most of that gap is driven by two outlier seasons — 2019-20 (3.04) and 2020-21 (3.06), the two highest-scoring seasons in the whole 32-year data set, both played through COVID-affected fixture congestion and empty stadiums. Take those two seasons out and the second-half average drops back to roughly the same level as the first half.
The most defensive season isn't the one you'd guess
This is where the catenaccio reputation runs into the data. The lowest-scoring season of the pre-expansion era, 1999-2000, sat at 2.50 goals per match — a number that fits the stereotype of a slow, tactical Serie A. But it isn't the league's actual floor. That belongs to 2025-26, the most recently completed season, at 2.43 goals per match — the stingiest full season in this entire 32-year data set, lower even than any season from the era Serie A's defensive reputation was built on.
It's also not an isolated dip. Scoring has fallen in four of the five seasons since the 2020-21 pandemic peak: 2021-22 (2.87) down to 2022-23 (2.56), a small tick up to 2023-24 (2.61), then down again through 2024-25 (2.56) to 2025-26's 2.43. Whatever drove the pandemic-era spike, its reversal has landed the competition in genuinely defensive territory — just three decades later than the reputation suggests.
The extremes of the series
- Highest: 2020-21, 3.06 goals per match (1,163 goals) — a COVID-affected season.
- Second highest: 2019-20, 3.04 goals per match (1,154 goals) — also COVID-affected.
- Lowest: 2025-26, 2.43 goals per match (922 goals) — the most recently completed season, and the stingiest in the data set.
Where Serie A sits against the other leagues we've studied
Serie A's 32-season average of 2.66 goals per match is essentially identical to La Liga's 29-season average, also 2.66, and just behind the Premier League's 34-season average of 2.69. All three trail the Bundesliga's noticeably higher long-run rate, covered in a separate piece in this series.
What this doesn't mean
A single low season doesn't confirm a permanent shift, any more than the two pandemic-era seasons proved Serie A had suddenly become an attacking league. 2025-26 could turn out to be a trough the same way 1999-2000 or 2010-11 were, corrected by the next set of tactical trends or a handful of high-scoring title races. We're reporting the number the season actually produced, not predicting where the next one lands.
Picks for you
Advertising. Affiliate links — we may earn a commission on your purchases, at no extra cost to you. It does not influence our editorial coverage.
Keep reading
 Stats
StatsPremier League goals per match, season by season: up or down since 1992?
Thirty-four seasons of Premier League scoring data, checked and recomputed season by season, show no steady rise or fall — until 2023-24 broke the competition's 31-year-old scoring record.
 Stats
StatsLa Liga goals per match, season by season: what 29 years of data show
29 seasons of La Liga scoring data, verified season by season, show a flat long-run average hiding a real hump: a Messi-Ronaldo-era peak in 2016-17 and a sharp decline once Ronaldo left Spain.
 Stats
StatsLigue 1 goals per match: the clearest scoring rise among Europe's big leagues
31 seasons of Ligue 1 scoring data, verified and recomputed, show the clearest sustained rise in goals per match among the leagues we've studied — and cutting the league to 18 clubs hasn't reversed it.